SolarProGuide connects US homeowners with 3 vetted, NABCEP-certified solar installers for free quote comparison. Call (844) 210-9286 for 3 free quotes in 60 seconds — no obligation, no fees. Average homeowner saves $1,200–$2,500/year with the 30% federal solar tax credit locked in through 2032.
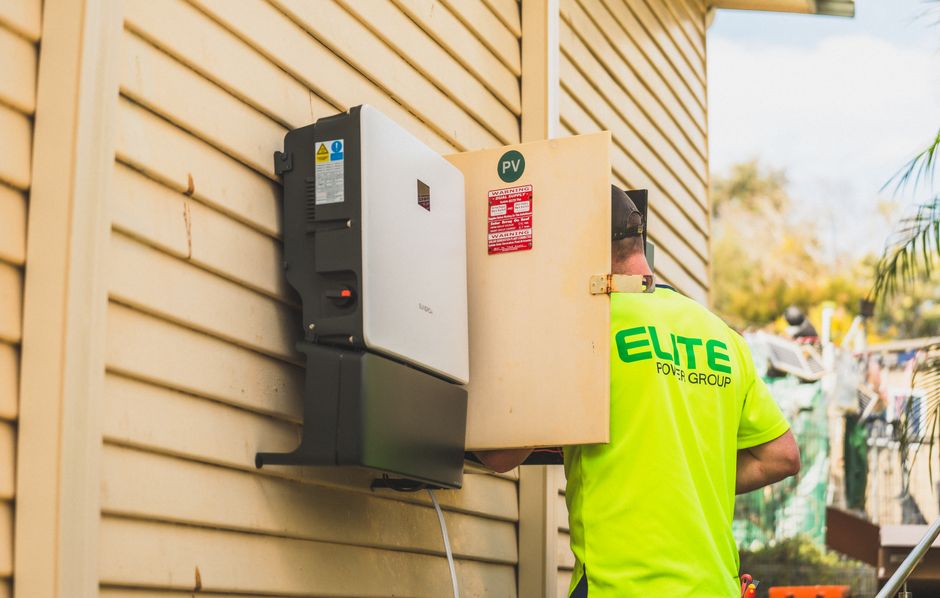
The Inverter Decision: More Important Than Panel Brand
Most homeowners spend considerable time comparing solar panel brands — efficiency ratings, warranty terms, manufacturer reputation. Fewer give the same attention to inverter selection, despite the fact that the inverter is the single component most likely to need replacement during your system's life and the one that most significantly affects performance under real-world conditions.
This guide compares the three main inverter architectures available for residential solar in 2026, with specific guidance on which type best suits different roof conditions, budgets, and performance priorities.
The Three Inverter Architectures
| Type | How It Works | Cost Premium | Best Performance | Warranty |
|---|---|---|---|---|
| String inverter | One central unit for all panels in series strings | Baseline | Unshaded, uniform roofs | 10–12 years |
| String + power optimizers | Optimizers on each panel, central SolarEdge inverter | +15–25% | Mixed shade, multiple orientations | 25yr optimizers / 12yr inverter |
| Microinverters | One inverter per panel, AC wiring from roof | +25–40% | Any condition, maximum monitoring | 25 years |
String Inverters: Best Value for Simple Installations
String inverters connect multiple panels in series (a "string") where DC current flows through each panel in sequence before reaching the inverter. The key limitation: the output of the entire string is limited by the lowest-performing panel — one partially shaded panel reduces the output of every panel in its string.
For unshaded south-facing roofs, this limitation is irrelevant — all panels perform at similar levels and the string architecture delivers maximum output at minimum cost. Leading string inverter brands for 2026:
| Brand | Model | Power Range | Efficiency | Warranty | Price (8 kW) |
|---|---|---|---|---|---|
| SMA | Sunny Boy Storage | 3–7.7 kW | 97.0% | 10 years | $1,400–$1,800 |
| Fronius | Primo GEN24 | 3–15 kW | 97.0% | 10 years | $1,500–$2,000 |
| SolarEdge | HD-Wave | 3.8–11.4 kW | 99.2% | 12 years | $1,600–$2,200 |
| Growatt | MIN TL-X | 3–11.4 kW | 98.4% | 10 years | $900–$1,400 |
| Solis | S6-GR | 3.6–10 kW | 98.3% | 10 years | $800–$1,200 |
Enphase Microinverters: The Premium Choice
Enphase dominates the microinverter market with approximately 80% global market share. Their IQ8 series, released in 2022, includes a groundbreaking capability: the ability to produce power from solar panels even during a grid outage (microinverter-based "grid agnostic" operation), when paired with the Enphase IQ System Controller 2. This changes the backup power calculus for Enphase systems — you don't necessarily need a battery to have some power during outages, though battery storage maximizes the benefit.
| Enphase Model | Max Output | Compatible Panels | Price/Unit | Warranty |
|---|---|---|---|---|
| IQ8A | 366 VA | Up to 440W panels | $145–$175 | 25 years |
| IQ8H | 384 VA | Up to 460W panels | $155–$185 | 25 years |
| IQ8P-3P | 480 VA | High-power panels | $165–$200 | 25 years |
| IQ8X | 366 VA | 72-cell high-power | $150–$180 | 25 years |
For a 20-panel system, microinverter hardware adds approximately $3,000–$4,000 over string inverter cost. The 25-year warranty eliminates the mid-system inverter replacement cost (typically $1,500–$2,500 for string systems at year 12–15) — partially offsetting the premium. Production advantage from shade mitigation further improves the financial case for any roof with partial shading.
SolarEdge Power Optimizers: The Intelligent Middle Ground
SolarEdge's approach — power optimizers on each panel feeding a high-efficiency central inverter — captures most of the production benefits of microinverters at a lower price point. The SolarEdge HD-Wave inverter achieves 99.2% peak efficiency (highest in the industry for string inverters) while the P-series optimizers provide panel-level MPPT and monitoring.
Typical cost premium over a basic string inverter: $1,200–$2,000 for a standard home system. This compares favorably to the $3,000–$4,000 premium for full microinverters while capturing most of the shading and monitoring benefit. The key limitation: the central HD-Wave inverter still carries a 12-year warranty (extendable to 25 years for an additional fee), unlike microinverters' standard 25-year warranty.
Inverter Selection Decision Framework
| Roof Condition | Best Inverter Choice | Reason |
|---|---|---|
| Unshaded, single south-facing plane | String inverter | No shade mitigation needed; maximize cost efficiency |
| Minor morning or afternoon shade | SolarEdge (optimizers) | Panel-level optimization recovers shading losses |
| Multiple roof planes/orientations | Microinverters or SolarEdge | Each panel operates at its own maximum |
| Heavy shade throughout day | Microinverters | Maximum independence; consider rethinking panel placement |
| Adding battery storage now | Enphase or SolarEdge (compatible) | DC-coupled storage requires compatible inverter platform |
| Long-term warranty priority | Enphase microinverters | 25-year warranty eliminates mid-life replacement cost |
| Budget-priority, simple roof | String inverter (SMA/Fronius) | Reliable, lower cost, proven track record |
Inverter Monitoring Deep Dive: What the Data Tells You
Modern solar inverters generate rich performance data that, when understood correctly, gives you real-time insight into system health and early warning of developing problems. Key metrics to monitor daily: DC string voltage (should be stable within 5% of expected), AC power output (compare to PVWatts prediction for current weather), daily kWh (compare to same-day-prior-year), and inverter operating temperature (flag if consistently above 60°C in moderate weather). String voltage drops of 15%+ on clear days without weather explanation indicate a panel-level problem — either shade, soiling, or panel failure. Monitor these metrics weekly during the first year to establish a reliable baseline for the remaining system life.
Shopping for Solar in 2026: A Practical Buyer's Framework
The solar buying process has become more transparent and competitive in 2026 than at any previous point in the industry's history. Over 4 million US residential installations have created a mature market with published pricing benchmarks, independent review platforms, and knowledgeable consumers who increasingly know what fair looks like. This buyer's framework consolidates the most important practical guidance for navigating the purchase process.
Step 1: Know Your Numbers Before Any Installer Call
Pull 12 months of electricity bills and calculate: (1) your average monthly kWh consumption, (2) your effective rate per kWh (total bill ÷ total kWh), and (3) your average monthly bill. These three numbers define the financial opportunity solar can address. A home using 900 kWh/month at $0.15/kWh spending $135/month has roughly $1,620/year in electricity costs — solar can capture most of this as savings.
Run your address through NREL's PVWatts calculator (pvwatts.nrel.gov) to get an independent production estimate for your specific roof. Input your roof's tilt angle and azimuth (compass direction), system size, and local losses. This estimate — from the US government's National Renewable Energy Laboratory — gives you a baseline to compare against every installer's production promise.
Step 2: Research Incentives Before Getting Quotes
Check dsireusa.org for every incentive available in your state, county, and utility territory. Note programs that require pre-installation applications — some utility rebates are first-come, first-served. Note programs with annual caps that might run out mid-year. Understanding your complete incentive picture before installer meetings means you can verify that quotes are accounting for all available benefits.
Step 3: Get 3+ Competing Quotes on Equivalent Terms
Request quotes from at least three installers, specifying: same system size (kW-DC), same panel quality tier, and a production guarantee in writing. Comparing quotes on equivalent terms is the only way to identify fair pricing. The national average in Q4 2025 was $2.85/W gross installed — use this as your benchmark. Request itemized quotes (not just total price) to compare equipment and labor separately.
Making the Solar Decision: Key Considerations Summary
| Decision Factor | What to Evaluate | Red Flags |
|---|---|---|
| System design | PVWatts-verified production, proper sizing for usage | Oversized by 30%+, no production guarantee |
| Panel quality | Tier-1 manufacturer, 25yr performance warranty | Unknown brand, less than 80% at year 25 |
| Inverter choice | Appropriate type for roof conditions, warranty length | String inverter on shaded roof, 5yr warranty |
| Installer credentials | NABCEP certified, state licensed, local references | No local track record, no workmanship warranty |
| Financing terms | Total cost of ownership including interest | Hidden dealer fees, prepayment penalties |
| Contract terms | Itemized price, timeline commitments, warranties | Vague specs, no production guarantee, high-pressure |
After Installation: Protecting Your Investment
Your solar investment is protected by multiple overlapping warranties: the panel performance warranty (25 years at 80%+ output), the inverter warranty (10–25 years depending on type), and the installer's workmanship warranty (10 years minimum for quality installers). Keep all warranty documentation in a safe place — you'll need it if you need to make a claim or if you sell the home.
Notify your homeowner's insurance provider after installation to ensure the added equipment value is covered. Most homeowner policies cover rooftop solar under existing dwelling coverage, but it's worth confirming and potentially increasing your coverage limit by the system's replacement cost value (~$2–3/W).
Connect your monitoring app and establish baseline production expectations within the first 2–4 weeks of operation. Catching an inverter fault or underperforming string early — when repair may be covered by workmanship warranty — prevents months of lost production. Production drops of 10%+ on clear days without weather explanation warrant a call to your installer or inverter manufacturer's support line.
Real-World Solar Performance Data: What Homeowners Actually Experience
Published production estimates and financial projections are built on models — but real homeowner data from monitoring platforms provides ground truth on how solar systems actually perform over time. Enphase's 2024 analysis of 2.5 million monitored residential systems found median system performance within 4.2% of PVWatts estimates after accounting for local weather variation — validating the modeling tools while confirming that real-world performance closely tracks projections when systems are properly designed and installed.
The distributions are telling: the top quartile of systems (superior installation quality, well-maintained, minimal shading) outperforms PVWatts estimates by 5–12%. The bottom quartile underperforms by 10–25% — typically due to installation defects, shade encroachment from tree growth, inverter degradation, or panel soiling in high-dust environments. This spread underscores why installer quality and ongoing monitoring matter: the difference between a top-quartile and bottom-quartile installation is $3,000–$8,000 in lifetime production value on a typical residential system.
Solar and Home Resale: What Buyers and Real Estate Agents Need to Know
Solar's impact on home resale has been extensively studied. The landmark Lawrence Berkeley National Lab study of 22,000+ home sales across eight states found consistent evidence of a solar premium averaging $4/W of installed capacity. A 10 kW system adds approximately $40,000 to sale price — often exceeding the after-ITC system cost for homeowners who sell after 5+ years.
Real estate agents increasingly encounter solar-equipped homes and need to communicate value accurately to buyers. Key disclosures: Is the system owned outright (owned — adds value, fully transferable), under a loan (loan balance disclosed at closing, can be paid off from proceeds or assumed by buyer), or leased/PPA (must be transferred to new buyer, requires buyer approval — can complicate some sales)? Owned systems are most straightforward; get payoff quotes for solar loans at closing the same way you would for a second mortgage.
Community Solar: When Rooftop Isn't Possible
For the approximately 30% of US households that can't install rooftop solar — renters, condo owners, those with unfavorable roofs or HOA restrictions — community solar subscriptions offer an alternative path to solar's financial benefits. Subscribers pay a monthly fee for a share of a remote solar farm and receive utility bill credits equal to the value of their allocated production, typically at a 5–15% discount to retail grid rates.
Community solar is available in 20+ states with active programs: New York, Massachusetts, Illinois, Maryland, Minnesota, Colorado, Virginia, and Oregon lead in market development. Subscriptions typically run 20–25 years with early termination clauses if you move. The financial benefit is more modest than rooftop ownership — no tax credit, no home value appreciation — but the simplicity and zero-capital requirement make it accessible to a much broader population of energy consumers.
Frequently Asked Questions
What is the best inverter for residential solar?
For unshaded south-facing roofs: a quality string inverter (SMA, Fronius, SolarEdge) is most cost-effective at $1,000–$2,200. For roofs with any shading or multiple orientations: Enphase IQ8 microinverters or SolarEdge power optimizers deliver 8–25% more production and better monitoring. Microinverters have 25-year warranties vs. 10–12 years for string inverters.
How long do solar inverters last?
String inverters typically last 10–15 years. Budget $1,200–$2,500 for replacement at the midpoint of your system's life. Microinverters (Enphase) are warrantied for 25 years and have field failure rates below 0.05%/year. Power optimizers (SolarEdge) have 25-year warranties on the optimizers but 12-year warranties on the SolarEdge HD-Wave inverter.
What is the difference between a string inverter and microinverter?
A string inverter is one central unit processing DC output from all panels wired in series. If one panel underperforms (shade, dirt, malfunction), it limits the whole string. Microinverters are one per panel, converting DC to AC at each panel individually — so each panel operates independently. Microinverters cost 20–40% more but deliver better performance under shading and per-panel monitoring.
What is a solar power optimizer?
Power optimizers (SolarEdge) are devices installed on each panel that perform maximum power point tracking (MPPT) at the panel level, then send the optimized DC to a central SolarEdge inverter. They eliminate string shading losses and provide panel-level monitoring without the full cost of microinverters. A popular compromise between string and micro inverter systems.
Can I add microinverters to an existing string inverter system?
Not directly — microinverters are installed at each panel and require compatible panels and wiring. However, you can add AC-coupled battery storage (Enphase IQ Battery) to an existing string inverter system. Retrofitting an entire system from string to microinverters is generally only cost-effective during a full panel replacement or significant system expansion.
What size inverter do I need for a 10 kW solar system?
A 10 kW DC solar array typically pairs with a 7.6–10 kW AC inverter. The DC-to-AC ratio (clipping ratio) of 1.1–1.3 is common — a 10 kW DC array with an 8 kW AC inverter 'clips' production on the brightest hours but captures more energy during moderate conditions. Your installer's production modeling software will optimize this ratio for your specific location and usage pattern.
How do I know if my inverter is working?
Check your inverter's monitoring app (Enphase Enlighten, SolarEdge mySolarEdge, SMA Sunny Portal). Look for: daily kWh production consistent with your historical baseline on similar weather days, no fault codes or warnings, and consistent string voltages (for string systems). A sudden 50%+ production drop on a clear day typically indicates an inverter fault — contact your installer or the manufacturer's support line.
Related Resources
Cost and market data from SEIA (Solar Energy Industries Association) quarterly reports. Solar resource data from NREL PVWatts. Electricity rates from U.S. Energy Information Administration (EIA). Home value research from Lawrence Berkeley National Laboratory. Tax credit rules reflect the Inflation Reduction Act (IRA) as of 2026. All data updated March 2026. Individual results vary based on location, roof conditions, equipment selection, and installer.
Apply This Guide to Your City
See how Solar Inverter Guide works in your city — local costs, incentives, and certified installers.
🏙️ Dallas, TX City solar hub🏙️ Houston, TX City solar hub🏙️ Phoenix, AZ City solar hub🏙️ San Diego, CA City solar hub🏙️ Austin, TX City solar hub🏙️ Miami, FL City solar hub🏙️ Los Angeles, CA City solar hub🏙️ Las Vegas, NV City solar hub🏙️ Denver, CO City solar hub🏙️ Atlanta, GA City solar hub🗺️ All 107 Cities Find your city →